We connect people to data and technology
Every project and partnership is uniquely different and requires an original, personalized solution. However, the common denominator in all our project is complexity.
Explore some of our highlighted projects below


Data USA is the most comprehensive visualization site for US Government data. It’s accessible to public, private, and non-profit organizations for the common good.
Data USA provides a free, easy-to-use data platform that allows everyone to access public data, do their own data analyses, and develop their own stories about America.
It visualizes critical issues the United States faces in areas like health, housing, education, and employment across industry and geography.
CLIENT
It was built as a partnership with Deloitte, which continues to be a strategic partner in the maintenance and enhancement of the site.
Data USA is the winner of the 2017 Webby Award for Government & Civil Innovation, and the winner of the 2016 Kantar Information is Beautiful Gold Award for Commercial/Business Projects.
AWARDS


DataMéxico allows the integration, visualization and analysis of public data to promote innovation, inclusion and diversification of the Mexican economy.
DataMéxico is a public platform that allows the integration, visualization, and analysis of data from different sources to improve the citizens’ access to information and support data-driven public policies.
It visualizes critical Mexican society and economic issues in areas such as demographics, employment, education, trade, and investment across industries and geographies, and includes an Economic Complexity exploration tool actively used by local and federal governments.
DataMexico has contributed to the economic promotion strategy led by the Mexican Secretariat of Economy (SE). We have partnered in a long-term collaboration with the SE to design, implement and maintain the site, as well as provide expert consultancy in Economic Complexity. The project has also been supported by the National Institute of Statistics and Geography of Mexico (INEGI) as one of the main data providers.
CLIENT


The Observatory of Economic Complexity (OEC) is an online data visualization and distribution platform focused on the geography and dynamics of global trade.
The OEC integrates and distributes trade data from various sources such as UN Comtrade and national costume agencies.
This platform is used by researchers, students, data scientists, and policymakers to analyze current economic trends.
The OEC began as a research project at MIT's Collective Learning group, and it is constantly being refined, expanding its analytical capacities for a better comprehension of global events.
A PROJECT OWNED BY


Spain’s first Economic Complexity Map is an interactive tool that provides a comprehensive analysis of the country’s economic development, growth, and diversification opportunities for its communities and provinces through trade data.
The platform allows a deeper understanding of Economic Complexity and its application in Spain’s context. It delivers a powerful tool for understanding a particular region's economic landscape and identifying growth potential opportunities for policymakers, investors, and entrepreneurs.
Spain’s Economic Complexity Map is an initiative driven by Fundación COTEC in its mission to promote innovation as a social and economic engine.
CLIENT


BIP Data is a public data visualization platform revolutionizing the comprehension of the public investment landscape in Chile.
The platform provides seamless access to historical and current data from the Integrated Projects Bank (BIP), sourced on a daily basis, and offers a deep dive into public investment data by sector, geographic location, and institution.
BIP Data empowers citizens, the public sector, and researchers to explore, analyze, and interpret public investment dynamics, serving as a robust tool to foster transparency, accountability, and better-informed decisions.
BIP Data is a project driven by the Undersecretary of Social Evaluation from the Ministry of Social Development, supported by the Inter-American Development Bank and the Budget Directorate of the Ministry of Finance. The platform was designed and developed by Datawheel.
CLIENT


DataMPE harnesses the power of economic and demographic data from the Federal Government and Central Bank in Brazil to promote innovation, competitiveness, and entrepreneurship among micro and small businesses.
DataMPE contributes to Brazil’s economic development and diversification by facilitating access to relevant insights, providing expert analysis of Brazil’s Economic Complexity, and helping small businesses identify new trends and expand strategically.
The public site is an initiative led by the Brazilian Service of Support for Micro and Small Enterprises (SEBRAE) in its effort to promote competitiveness and sustainable development of smaller businesses.
CLIENT


Healthy Communities NC allows a visually integrated analysis of socioeconomic indicators from North Carolina, enabling the alignment of the community toward the goals of the Healthy NC 2030 initiative.
The platform combines around 1,000 up-to-date and localized metrics from public sources, regional anchor institutions, and partner organizations, allowing a closer look at relevant demographic, economic, and public health indicators through downloadable and interactive visualizations.
These insightful reports are searchable by region and county, improving the community’s ability to set new goals and measure public policy.
The site was developed alongside the Cape Fear Collective non-profit to achieve the goals set by the North Carolina Institute of Medicine (NCIOM) and the North Carolina Department of Health and Human Services (NCDHHS) toward a prosperous state.
CLIENT

Abu Dhabi EC Project

The Abu Dhabi Economic Complexity Project is an interactive platform that provides key insights to help tackle the challenges of economic diversification in the Abu Dhabi region.
Using the Economic Complexity Index (ECI), the platform analyzes two decades of trade data to identify strategic opportunities for Abu Dhabi's economic growth. This dynamic report, seamlessly bilingual in Arabic and English, transforms complex data into actionable insights, offering a visual roadmap for decision maker.
This tool navigates the intricacies of economic analysis. It establishes a precedent for informed decision-making, fostering inclusive, sustainable growth and bolstering Abu Dhabi's global competitiveness at the international and regional levels.
The Abu Dhabi Economic Complexity Project was initiated at the request of the Statistics Center - Abu Dhabi (SCAD) in collaboration with Datawheel.
CLIENT


Data Africa is an open data platform designed to provide information on agriculture, climate, poverty, and child health across Africa at country and sub-national level.
Data Africa is a platform focused on state and province levels. It has data for 13 countries: Burkina Faso, Ethiopia, Ghana, Kenya, Malawi, Mali, Mozambique, Nigeria, Rwanda, Senegal, Tanzania, Uganda, and Zambia. The platform integrates datasets for agriculture, climate poverty, and health, providing comprehensive visualizations and automated reports for the 13 countries above-mentioned.
CLIENT

The tool was built in collaboration with the International Food Policy Research Institute (IFPRI) and has been used for sustainable policy planning.
Data Africa is the winner of 2018 Webby Award for Government and Civil Innovation.
AWARDS


The CIREN Institutional Observatory is a public platform with more than 25 years of agricultural, soil, and climate information on Chile.
The Institutional Observatory was built in collaboration with the National Resource Information Center (CIREN). It allows navigating and analyzing CIREN data on four main categories: Cadastre, Soil, Climate, and Geography.
The site includes a tool for users to create and download custom visualizations and data tables.
This platform is aligned with the Chilean Ministry of Agriculture (MINAGRI) strategy through the timely delivery of data to contribute to planning and decision-making in the agro-industry.
CLIENT


ITP Producción is a public data platform that fosters research and innovation, accessible to the general public, researchers, and the private and public sectors.
ITP Producción provides Peruvian national and regional data linked to economy, industries, and technology transfer to support strategic data-driven decisions.
This platform offers a single point of access to relevant data from various government sources.
ITP Producción was built in collaboration with the Technological Institute of Production of the Ministry of Production of Peru and with the support of the Inter-American Development Bank (IDB).
CLIENT


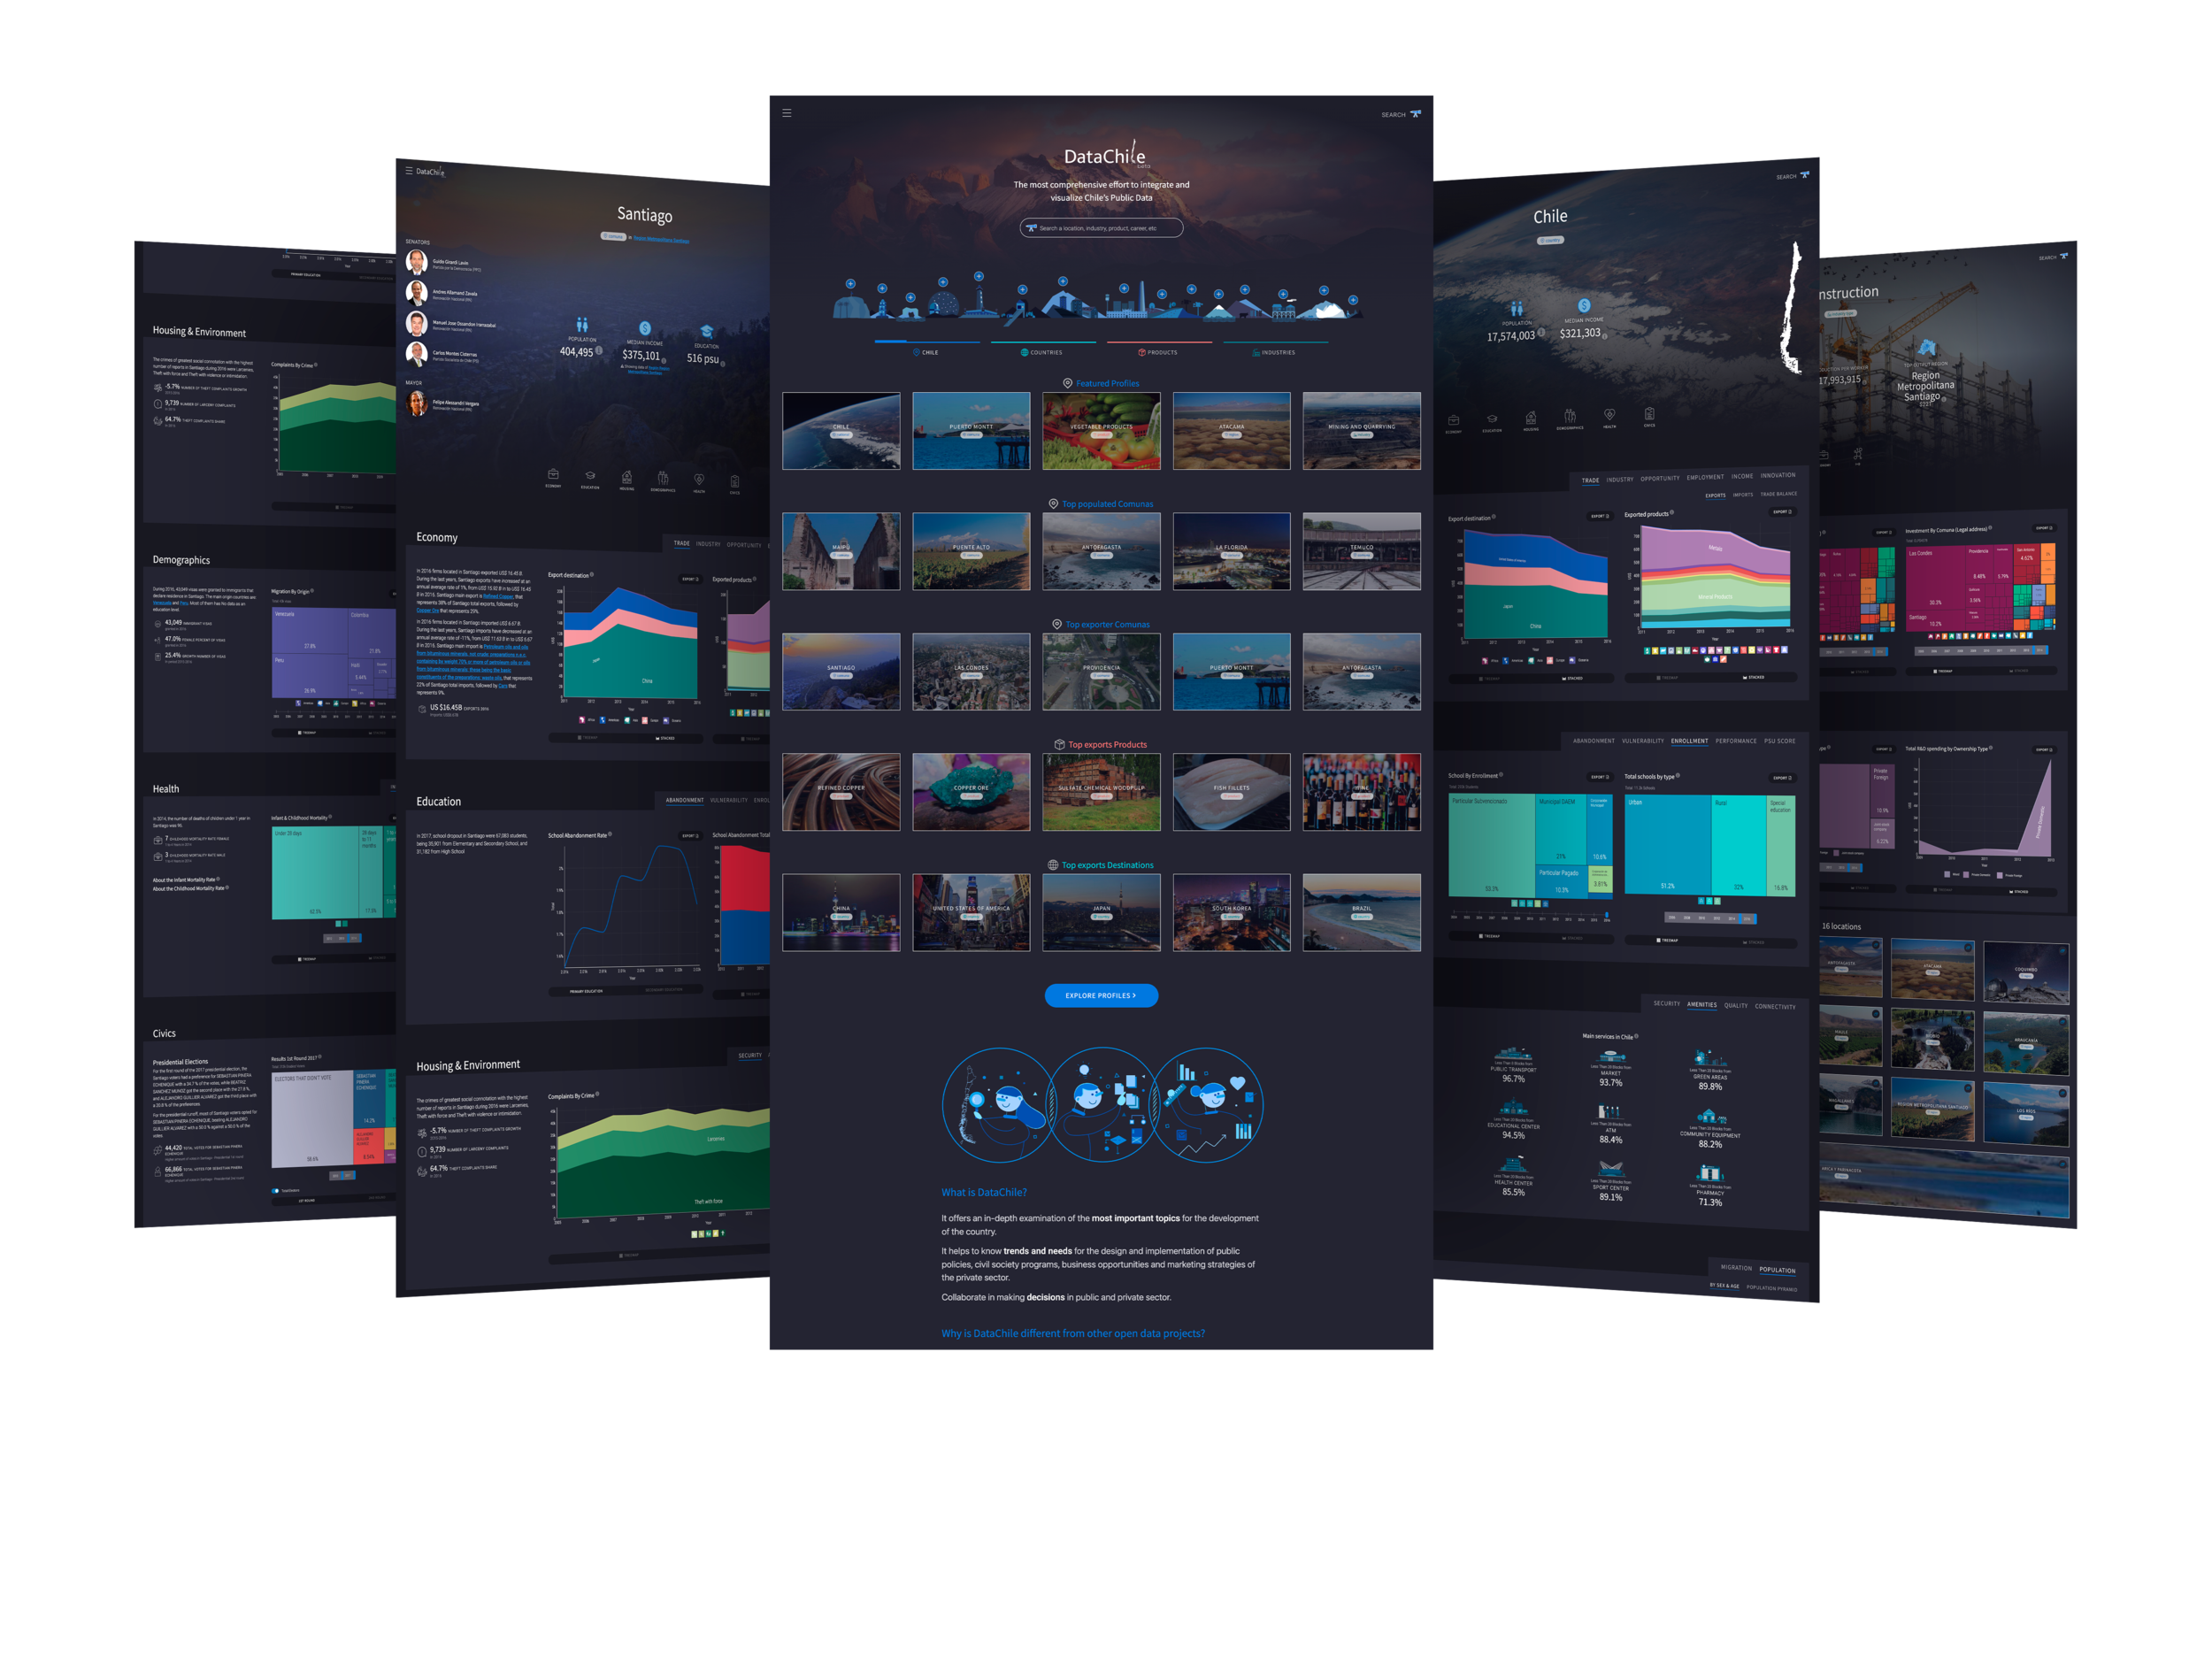
DataChile is an open data platform that aims to foster innovation and the digital transformation of the public sector.
DataChile integrates and visualizes data from more than a dozen government offices to provide a high-resolution view of Chile’s trade, industries, education, employment, immigration, living conditions, etc.
It has been used by researchers, students, private sector analysts, and policymakers.
CLIENT

This platform was built in collaboration with the Chilean Ministry of Foreign Affairs and was funded by the National Economic Development Agency (CORFO).
DataChile is the Gold Winner of the 2018 Indigo Website Design Award and Winner of the 2020 German Design Award in Excellent Communications Design Web.
AWARDS


The Argentina Public Investment Gap Visualization Platform is a governmental tool built to analyze public investment and budget allocation.
This platform provides a data-driven approach to planning public investment. It visualizes the gaps identified by the Argentinean Government in sectors such as education, health, energy, and housing.
The tool also calculates the Health Deprivation Index developed especially for this project and visualizes it in a high-resolution 3D map.
CLIENT

It has been used as part of the public investment decision process led by the Public Investment Unit within the Jefatura de Gabinetes of Argentina.
This platform was built in collaboration with the Jefatura de Gabinetes and was funded by the Inter-American Development Bank (IDB).


The Data Breach Investigations Report is annually published by Verizon to provide crucial cybersecurity information to understand threats and weaknesses.
The Verizon Data Breach Investigations Report (DBIR) has been used to share the company’s experience and threat intelligence analysis to help organizations improve their network security, compliance, and incident response. The report is a key pillar of the cybersecurity expertise Verizon holds and an added value for clients.
This digital report is annually updated upon the analysis of security incidents worldwide, digging into the overall threat landscape and the actors, actions, and assets present in breaches.
CLIENT


CNY Vitals Pro aggregates and visualizes socioeconomic indicators of Central New York counties to track progress and plan actions in the region.
CNY Vitals Pro was built to visualize relevant information for the five counties where the Central New York Community Foundation operates.
It provides a common source of data and interactive reports on critical issues affecting the economy, housing, health, demographics, poverty, and education for Onondaga, Madison, Cayuga, Cortland, and Oswego counties.
CLIENT
The platform was built in partnership with the Central New York Community Foundation.
AWARDS


Statistics Estonia’s Foreign Trade Application is a public platform that visualizes the country’s international commerce data.
The Foreign Trade Application shows the commodity flows of exports and imports of products between Estonia and other countries.
The platform visualizes 15 years of the country's trade history by year, quarter, and month. It includes a Visualization Builder to generate custom data charts.
The site was built in collaboration with Statistics Estonia to empower researchers and businesses interested in digging deeper into market dynamics and opportunities.
CLIENT

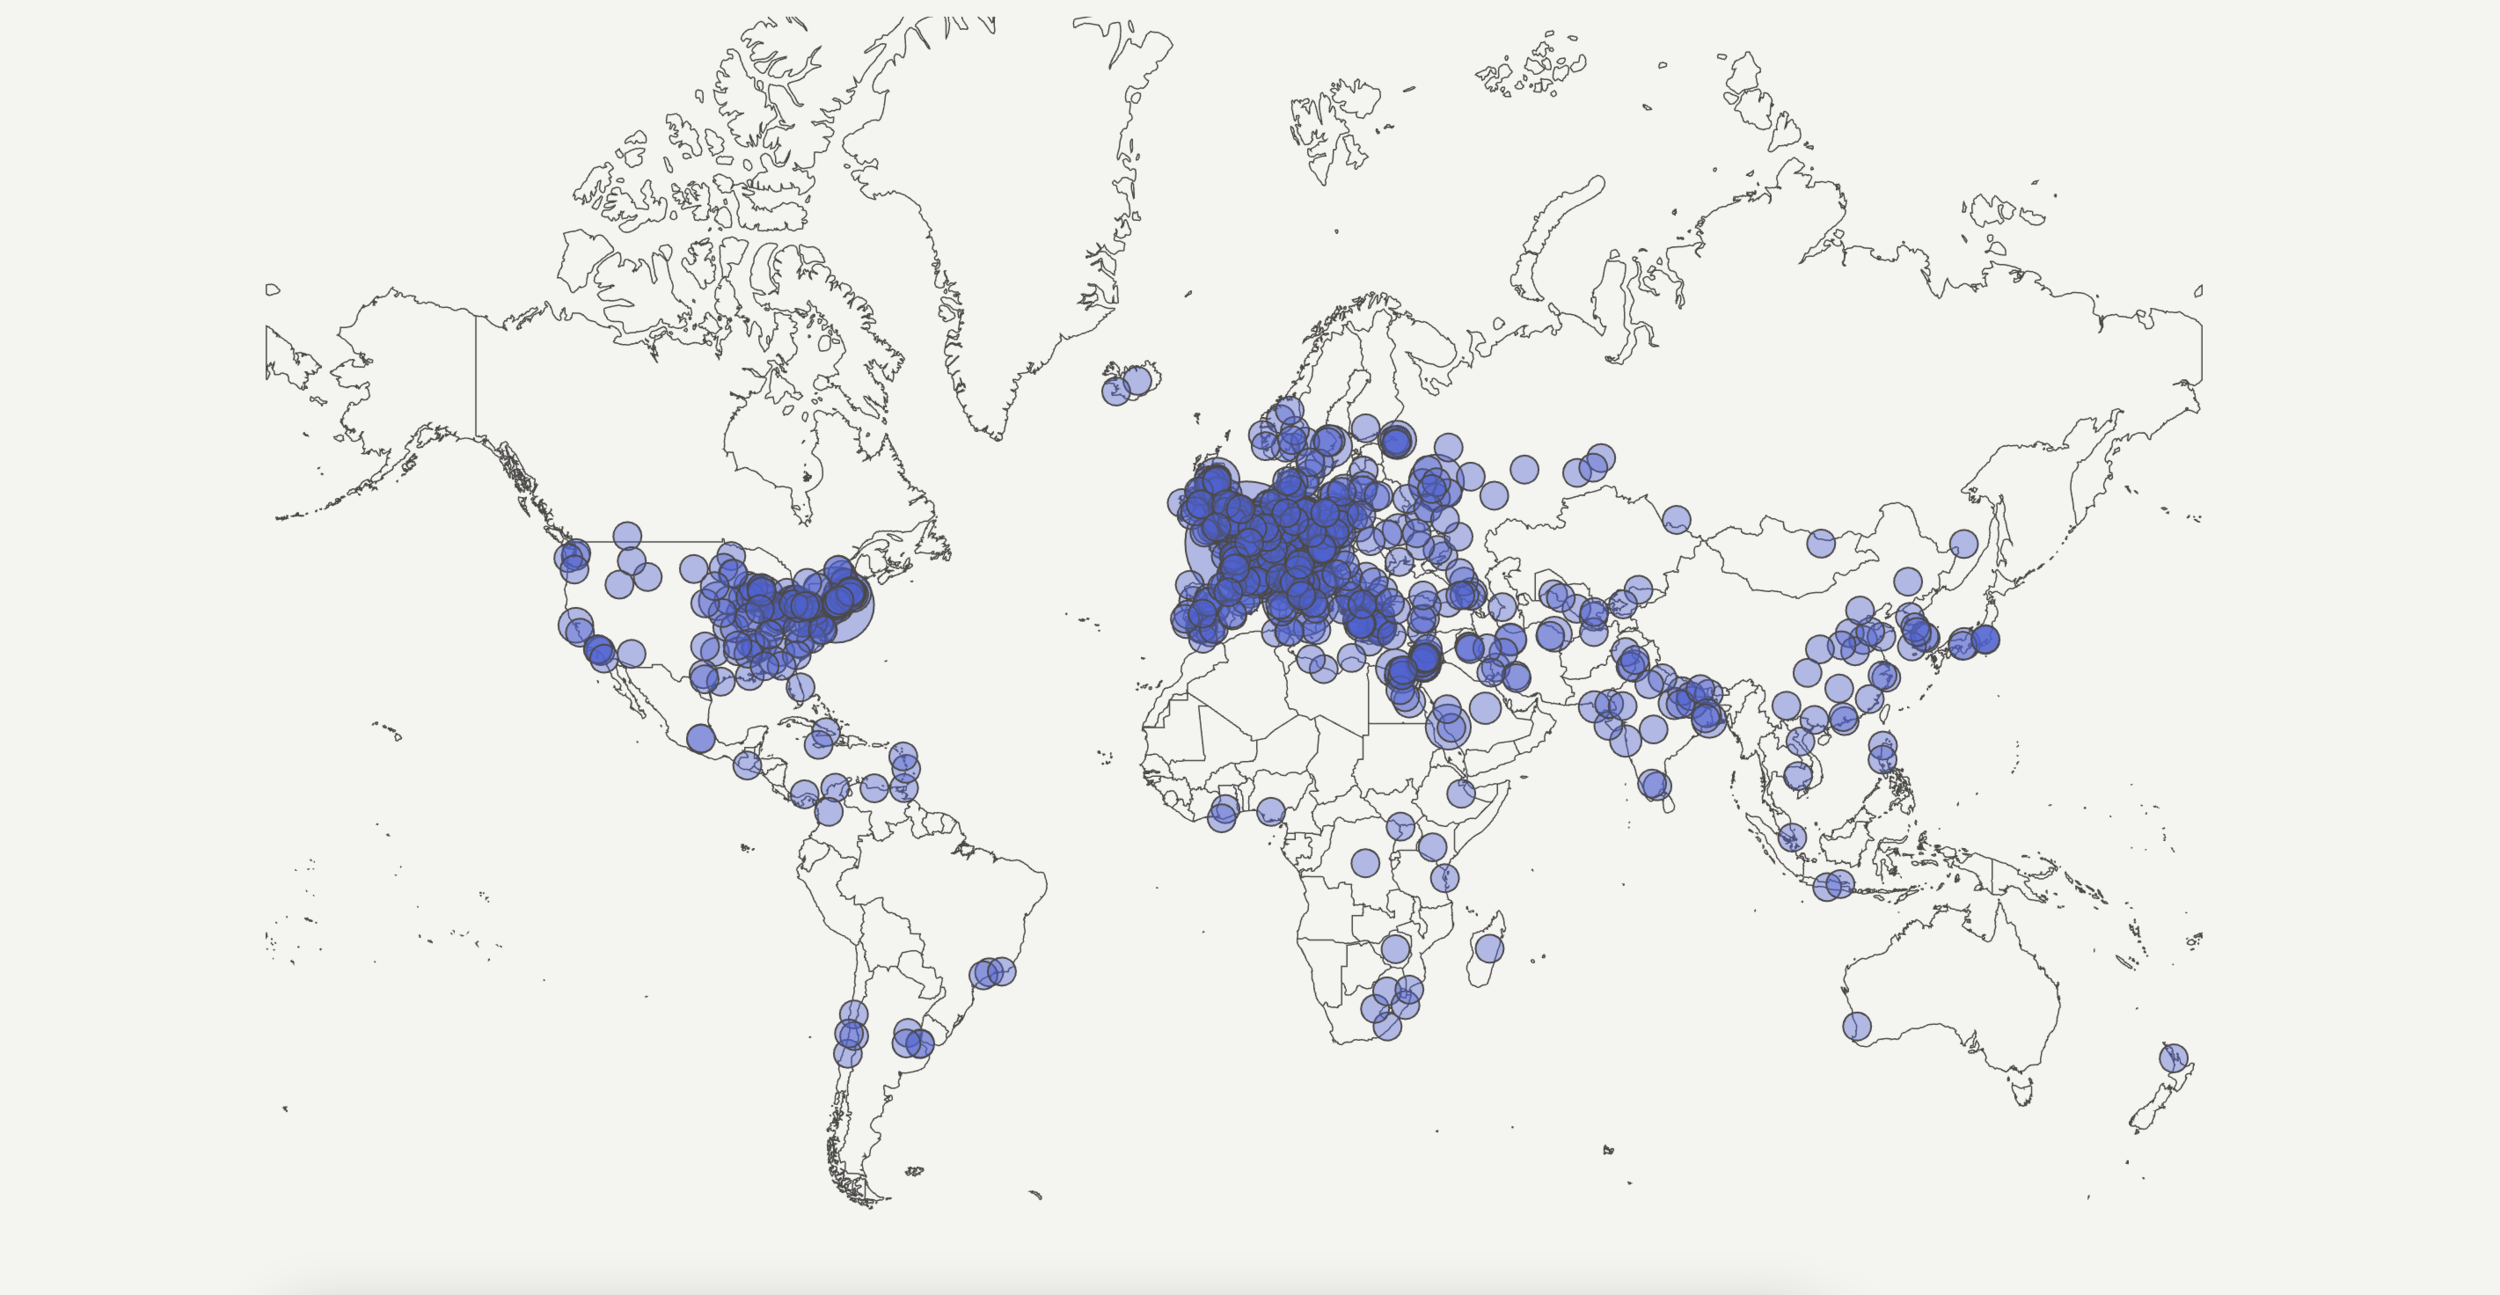

Pantheon is an open platform that uses biographical data to expose patterns of collective memory.
Pantheon contains data on more than 70k biographies, distributed through a powerful data visualization engine.
Pantheon’s biographical data includes information on the age, occupation, place of birth, and place of death of historical characters with a presence in more than 15 language editions of Wikipedia.
The site also uses real-time data from the Wikipedia API to show the dynamics of attention received by historical characters in different languages.


DataViva is a research tool that provides official data about trade, economic activity, education, and occupation in Brazil.
DataViva was created to contribute to the design of data-based public policies, promote private and public investment, and encourage academic research by visualizing official data on trade, industries, and education throughout Brazil.
DataViva helps create a solid basis for dialogue between the public and the private sector, supported by empirical data.
It was an initiative of the Minas Gerais State Government and the Minas Gerais Investment and Trade Promotion Agency (INDI), with the support of the Fundação de Amparo à Pesquisa do Estado de Minas Gerais (FAPEMIG).
CLIENT


JobsKSA visualizes labor data for Saudi Arabia into thousands of reports published on a private platform.
This platform integrates data around skills, occupations, industries, education, and origins of the labor force, helping the government understand what type of policies would be needed to promote, retain and grow human capital.
The site supports English and Arabic, and was built in collaboration with the Saudi Arabia Royal Jobs Commission.
CLIENT


CodeLife is an interactive course that equips students with the basic skills needed to develop interactive web content to complement their formal education.
Through the course, students learn the basics of HTML, CSS, and JavaScript, participating in web engineering and web design projects.
Codelife was implemented through two pilots in public schools in Brazil to understand its real impact, needs, and advantages.
CLIENT
It was built as a partnership with the State Funding Agency of Minas Gerais (FAPEMIG) to help the government offer tools for students that could enhance their technical skills to promote STEM education as part of the region and country development strategy.


The Patient Safety Atlas is a public site built to explore and visualize data on Antibiotic Resistance and Healthcare-Associated Infections.
This platform visualizes data on antibiotic resistance and healthcare-associated infectious diseases to help the CDC Division of Healthcare and Quality Promotion achieve its mission to protect patients; protect healthcare personnel; and promote safety, quality, and value in national and international healthcare delivery systems.
This site was built in a collaboration with Deloitte.
CLIENT

More projects
-
![]()
Open Source Compass
Open Source Compass is an open source website that delivers insights into open source development by visualizing trends in technology domains, projects, programming languages, and locations. Easy to use and customizable, Open Source Compass allows you to compare, map, share, and download data, and it helps answer questions central to technology decisions. It was built as a partnership with Deloitte.
-
![]()
Antofagasta Minerals
The project was a dynamic design of an internal risk operation platform that visualizes accident log and quasi-accidents of the health and safety area, with the purpose of mitigating operational risks. It was the result of a user research analysis done in collaboration with the Antofagasta Minerals team. As part of the design we provided a feasibility analysis with a roadmap for the company to implement the dynamic design.
-
![]()
DataEstee Innovation
DataEstee Innovation is a comprehensive internal visualization platform that integrates data from all areas of the company to facilitate business decisions at various levels of the organization.
The project is the result of a one year partnership with the Innovation unit led by the CIO, and the support of the marketing and technology areas of the company.
-
![Economic Complexity dashboard]()
Economic Complexity in Uruguay
The Economic Complexity dashboard is a dynamic report of the countries development potential (Potencialidades del Desarrollo de los corredores Este y Litoral) for the Oficina de Planeamiento y Presupuesto (OPP) de la presidencia de la República of Uruguay. The project was supported by the Division of Urban Development and housing of the Inter-American Development Bank (IDB).
-
![Lixandria]()
Lixandria
Lixadria, is a public interactive site to help students find the best career option based on secondary education data of every education institution in Chile. It was built in collaboration with Universidad del Desarrollo (UDD), and financed by a CORFO grant.
-
![]()
SteelcaseDBR
SteelcaseDBR is a platform design that focuses on addressing the communication and visualization of accurate shipment information to enhance Steelcase’s operation productivity.
-
![]()
InsightsCloud
This report was developed to show the results of a recent Deloitte survey aimed to answer the current state of organizations that successfully leverage cloud and how cloud strategy and maturity affect business performance and innovation.
-
![]()
Unlocking Knowledge
Alphasights powered the development of this platform in collaboration with Datawheel, as a way to showcase its global impact and commitment to the understanding of knowledge and how it spreads.