Drive Economic Progress with Data Science and AI


Cutting-Edge Solutions for Economic Development and Open Data
From ministries of economy to investment promotion agencies and NGO’s, our clients are organizations eager to be at the forefront of economic development and innovation.
Our scalable data solutions result in award-winning digital transformation projects, and our strategic reports empower sustainable growth and innovative economic diversification strategies.
I am looking for:
Trusted Worldwide
-
![Collage of graphics and information about the U.S.-Mexico border, including maps, charts, and diagrams illustrating trade, supply chains, and border crossing data.]()
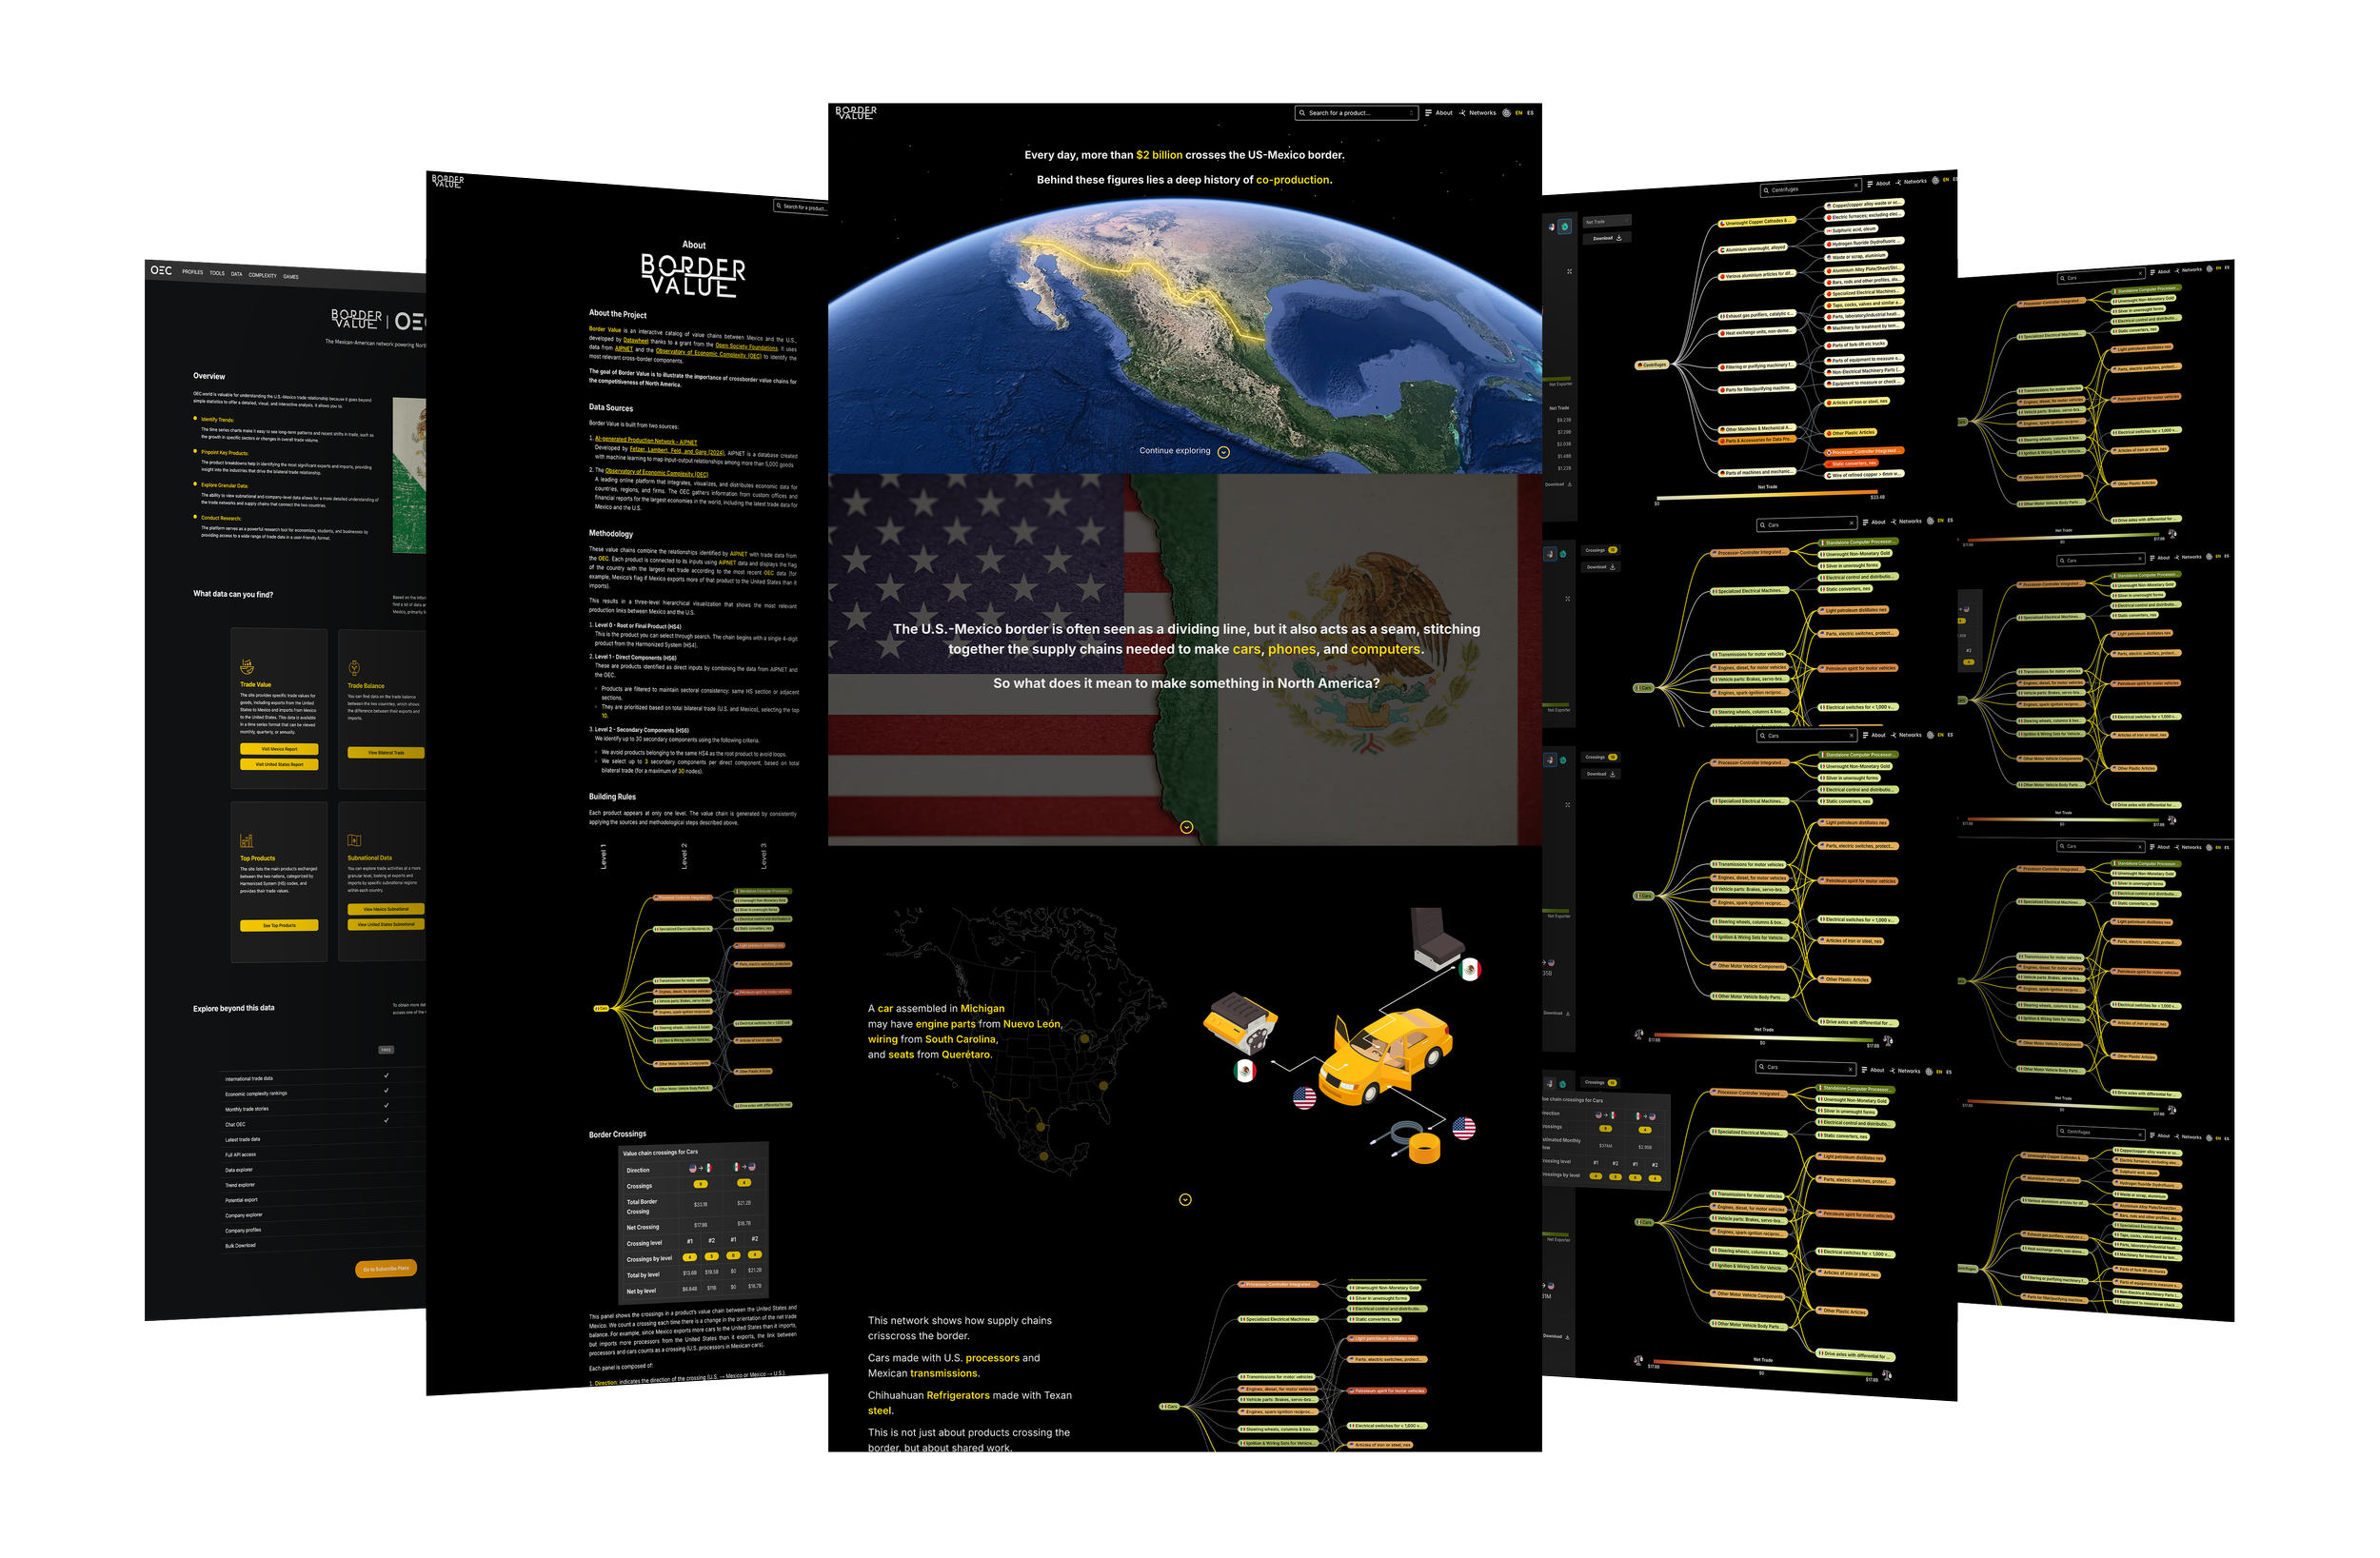
Border Value 🌎
Showcasing the deep story of co-production in North America,
-
![Screenshots of various data dashboards and reports, including maps, charts, and graphs related to COVID-19 statistics, population data, and U.S. demographics.]()
DataUSA 🇺🇸
The go-to platform for exploring and visualizing U.S. public data.
-
![Homepage of Data MPE Brazil featuring information about data and resources for small business development in Brazil. Contains sections with maps, charts, and images of people using data tools.]()
DataMPE 🇧🇷
A leading Brazilian platform focused on small and medium businesses.
-
![Screenshot of the DataMéxico website showing maps, charts, and information about Mexico's economy, COVID-19 cases, and various industries.]()
DataMexico 🇲🇽
The flagship data distribution tool of Mexico’s Secretary of the Economy.
-
![Screenshot of a data dashboard showcasing economic indicators and reports for the Kingdom of Saudi Arabia, including visuals of cityscapes, maps, and various graphs and charts.]()
DataSaudi 🇸🇦
A unified platform to analyze the latest economic and social data for the Saudi Arabian Kingdom.
-
![Infographic about Spanish economic complexity with maps, charts, and text in Spanish, featuring sections on exports, imports, economic growth, diversity, and product variety.]()
Spain Complexity 🇪🇸
Explore the latest economic complexity data for Spain and its provinces.


Tools Built for Now, Ready for What’s Next
The OEC Tariff Simulator was created in response to rapid shifts in global trade policy, allowing users to simulate the impact of new tariff scenarios and understand their effects with clarity and speed.
From journalists and economists to government officials, the simulator is already helping decision-makers all over the globe explore the implications of real trade developments.

What Makes Us Unique
Fully Customizable
Our platforms are built around your team’s questions, incluiding anything from data visualization and distribution to AI-powered forecasting and LLMs.

Economic Complexity
Our founders pioneered the field of economic complexity, applying machine learning methods to questions of economic growth, economic geography, and international development.

User Interface & Design
We are pioneers in user interface and design. We produce the best-looking and most intuitive open data solutions on the market.

Built for Visibility
Our solutions are designed with Search Engine Optimization (SEO) and AI optimization in mind, guaranteeing a constant flow of users.

Capacity Building
We provide technical training so your team can use the latest technologies and concepts.

Licence-free
Our solutions are built on industry-standard open-source technologies that can be deployed on a variety of pre-existing infrastructures.

What We Deliver
-
![Multiple digital screens displaying maps, charts, graphs, and infographics on a black background.]()
Data Platforms
Our solutions are simple, beautiful, and solve complex digital transformation challenges.
-
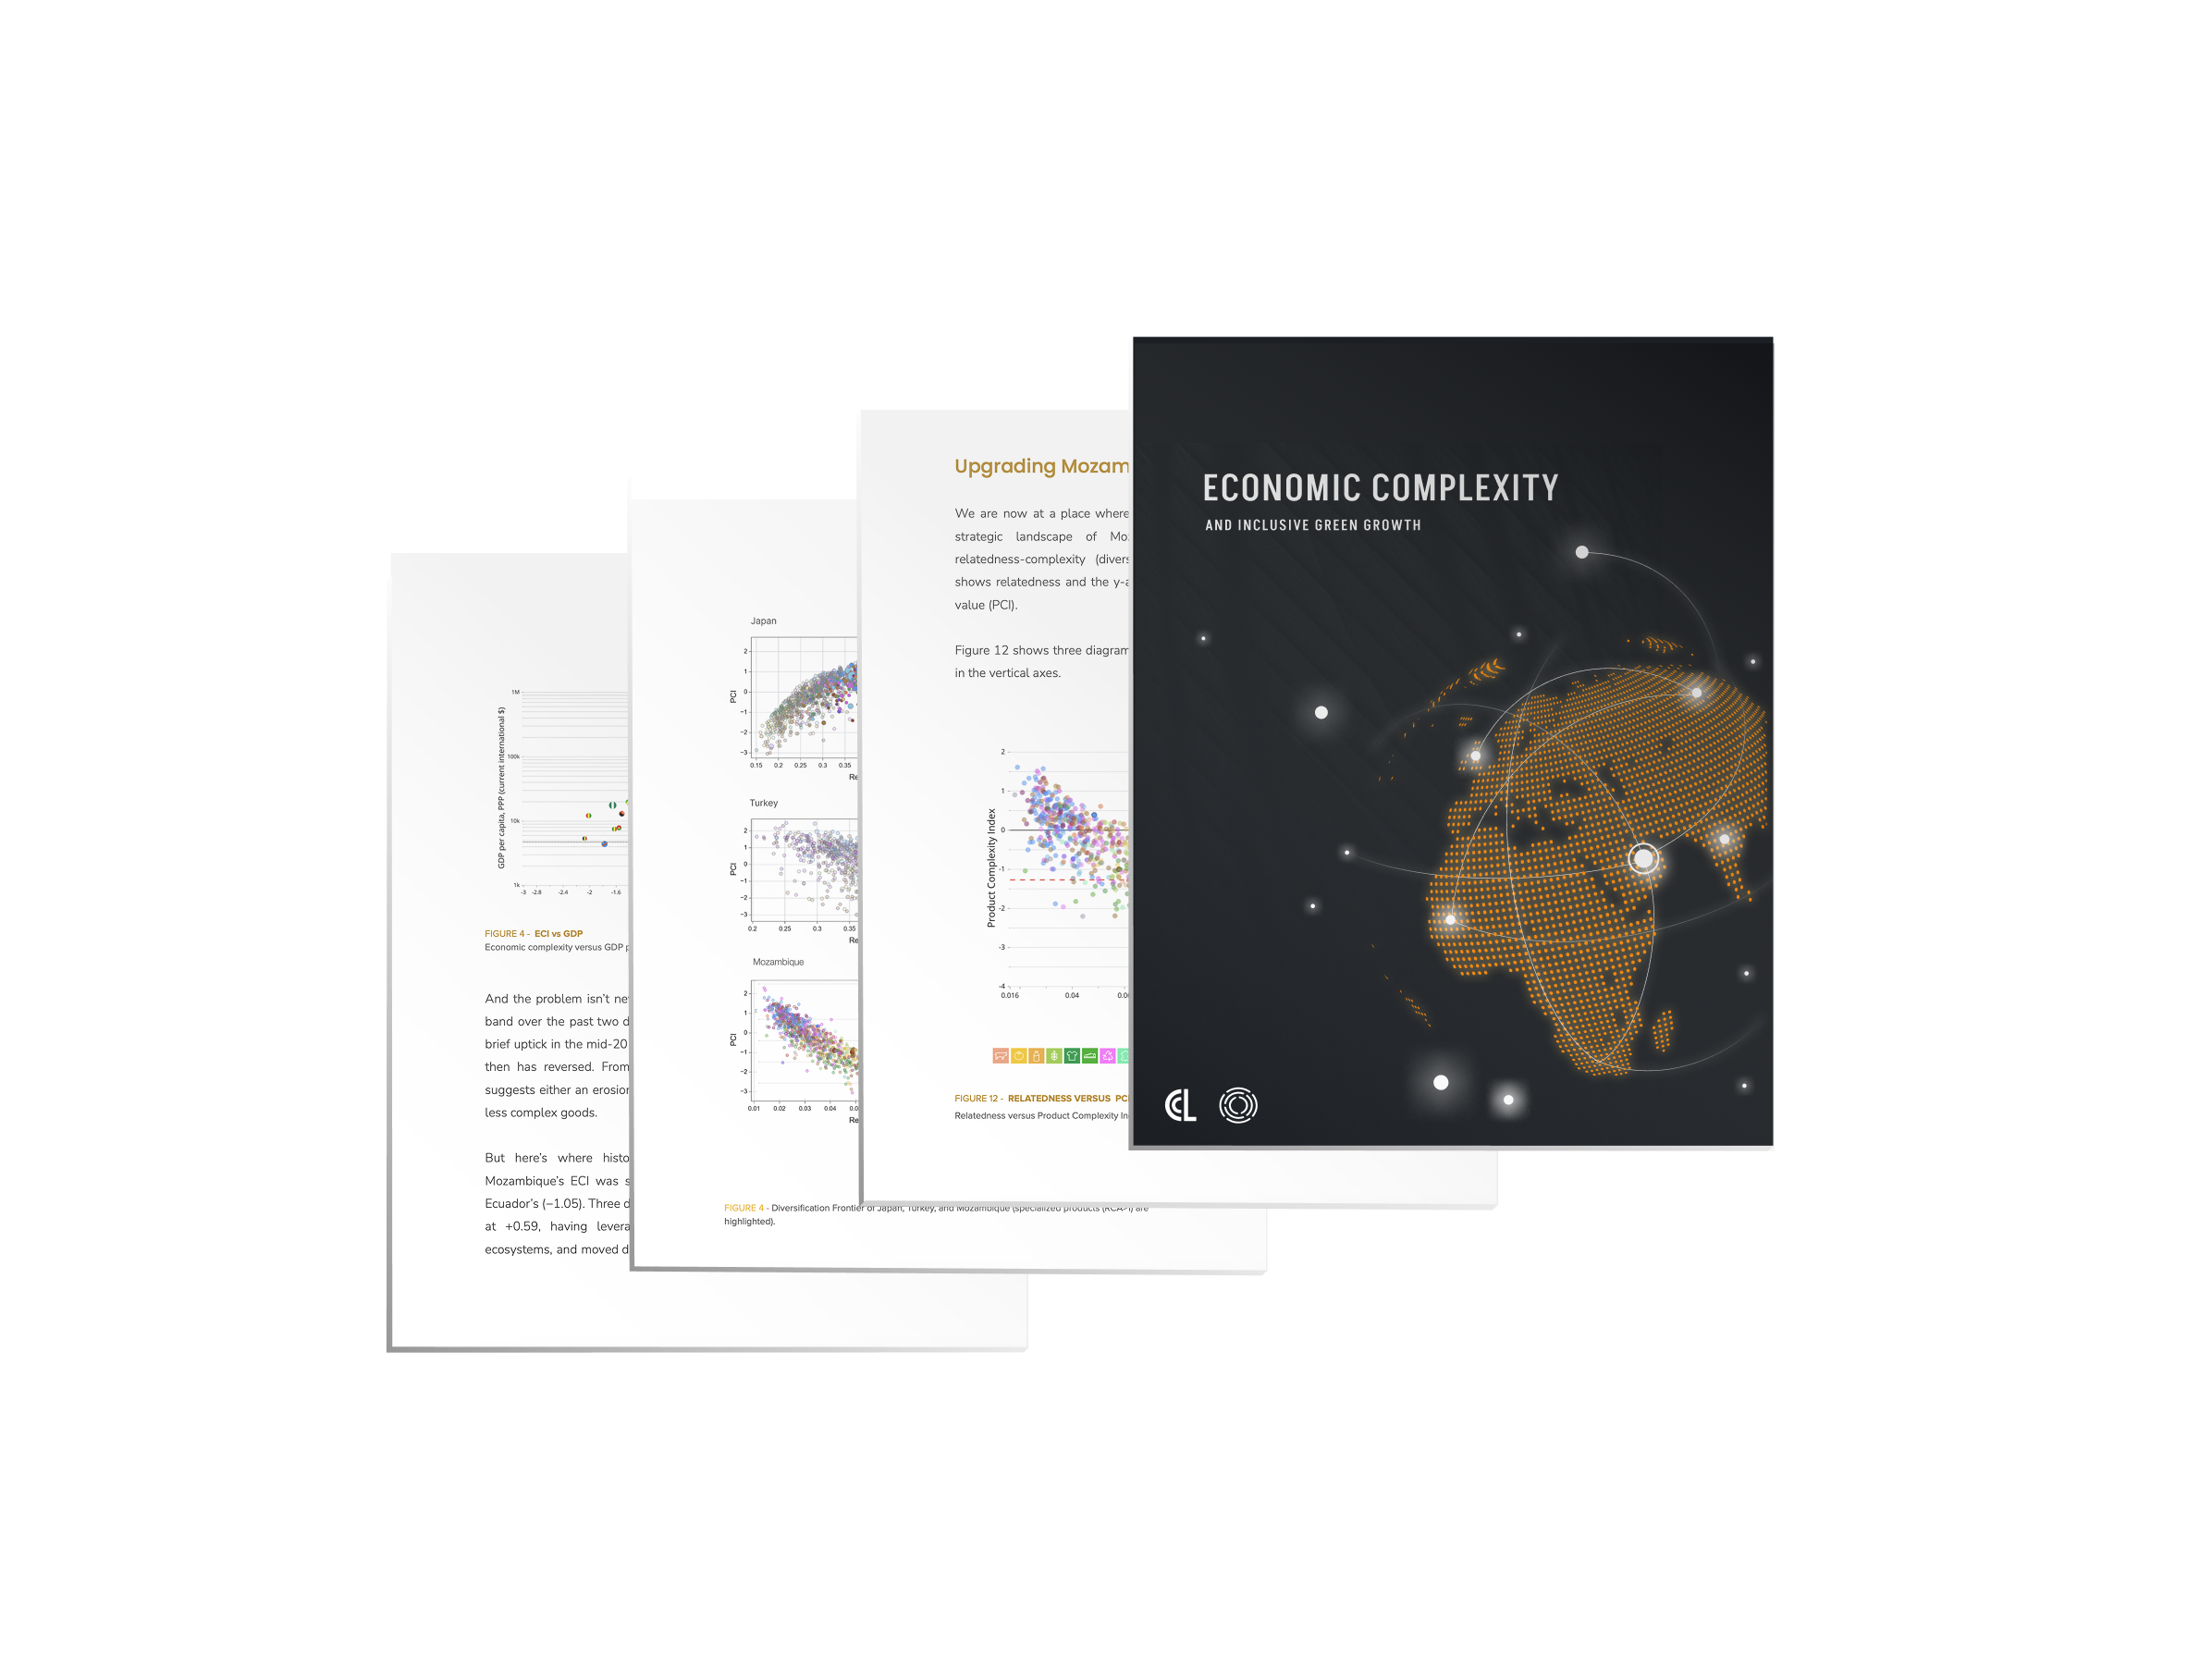
![A stack of reports or presentation slides with the top one titled 'Economic Complexity' featuring a graphic of a digital globe focusing on Africa and Europe, with interconnected points and glowing dots.]()
Strategy Reports
We work with governments and international organizations to create tailored economic development strategies.
-
![Screenshot of multiple overlapping digital dashboards and charts related to trade, tariffs, and exports data, including maps, bar charts, and tables.]()
Data Science & AI
We use AI and Data Science to take on complex challenges, from estimating economic potential, to modelling the impact of tariffs.


Data Platforms

In a world where bits travel at thousands of miles per second, the last 20 inches of the journey—those separating the screen from the user—are where communication stops.
Open data is not new, but most open data solutions are fragmented, inefficient, and unintuitive. At Datawheel, we specialize in creating high-end data distribution solutions that allow your data to reach a user’s mind. By combining data visualization, forecasting, and AI with intuitive user interfaces, we have created flagship national economic data observatories for the United States, Mexico, and Saudi Arabia, among other places.
Our solutions are based on a unique stack that we have developed for over a decade. A powerful CMS that works like “WordPress” for data-intensive sites will allow you to create data distribution systems that are rich in terms of visualization and interactivity. AI and forecasting tools will allow you to obtain prospective advice. Our expertise with government data and economic indicators will make you feel at home when collaborating with us.
The best way to understand what a Datawheel platform can do is visiting one
Interested in the latest trade data? Visit the OEC
Want to learn more about the Kingdom of Saudi Arabia? Visit Data Saudi
Curious about Spain's export performance? Visit Cotec’s export data observatory
Strategy Reports
Our Economic Complexity Reports dive into your country's productive capabilities, revealing untapped industries, emerging opportunities, and strategic pathways for economic diversification.
Built on the globally recognized Economic Complexity framework, our reports help governments, development agencies, and investment promotion offices identify sectors with the highest potential for growth and transformation. We combine export data, labor trends, and innovation indicators, such as patents and research publications, in reports that uncover what your economy could produce next, and how to get there.
Each report is tailored to your region’s unique economic DNA, offering clear visualizations, strategic recommendations, and benchmarking tools to guide long-term planning and attract smart investments.
Data alone isn’t enough. Let us help you translate it into structural change.

Data Science & AI
We specialize in building machine learning and AI-powered tools that drive evidence-based economic development.
With over a decade of experience, we’ve developed export potential models that accurately forecast trade flows, explaining over 88% of export variance years in advance. Our custom-built tariff simulation tools have helped major economies evaluate policy scenarios and guide international trade strategies. Beyond trade, our data science solutions have supported governments in identifying health system gaps and optimizing public spending.
Whether you're seeking tools for economic forecasting, AI-driven policy modeling, or LLM-powered decision platforms, Datawheel delivers trusted solutions that turn complex data into strategic action.

Our Leadership
-
![A man with long, dark hair and a beard, wearing a black sweater, has crossed arms and is smiling slightly at the camera against a plain white background.]()
Cesar A. Hidalgo
CO-FOUNDER & CO-CEO
César pioneered the study of economic complexity, combining data science, network theory, and AI to understand how knowledge flows shape economic development. His groundbreaking work has redefined how we measure and visualize the capabilities of nations, firms, and individuals and has changed the global conversation on economic development. Hidalgo is a tenured professor at the Toulouse School of Economics and the founder and director of the Center for Collective Learning (CCL) an interdisciplinary research group with offices at the Toulouse School of Economics and Corvinus University of Budapest
-
![A young man with light brown hair and a beard, smiling, wearing a dark denim shirt against a white background.]()
Alex J.G. Simoes
CO-FOUNDER & CO-CEO
Alex is a data entrepreneur and one of the driving forces behind Datawheel's mission to transform the way people interact with data. He has more than fifteen years of experience in the creation of open data solutions such as the OEC, Data USA, and Data Mexico. Simoes has led many of Datawheel’s key innovations, from the creation of its first platforms and software libraries, to recent advances in data gamification (e.g. tradle).
-
![A man with a beard and short dark hair, wearing a dark gray T-shirt with a hat graphic, standing against a plain white background.]()
Pablo Paladino
PARTNER & CTO
Pablo is a veteran web development engineer who has led the creation of several cutting-edge data platforms. At Datawheel, Pablo oversees the development of scalable, user-friendly solutions that integrate diverse data sources into seamless experiences. With over 15 years of experience in software engineering and system architecture, Pablo has been instrumental in building Datawheel's reputation for delivering high-performance, durable platforms that unlock insights for organizations and communities worldwide.